3.2.2 Connection
Demand Analysis
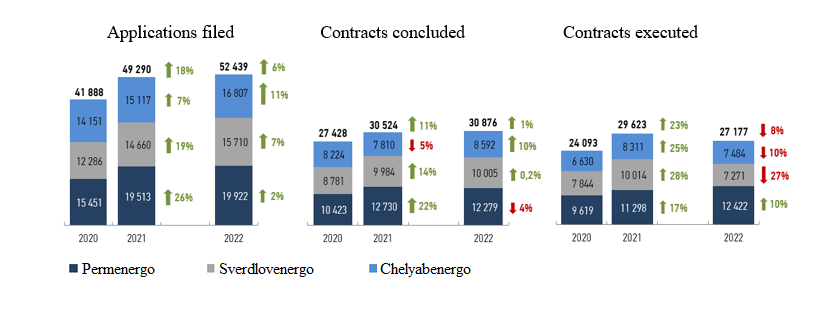
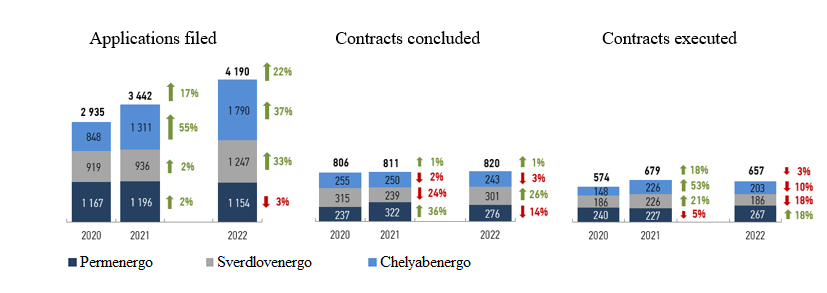
The demand for connection to the networks in 2022 increased in comparison to 2021. The total number of applications for connection, filed with the Company, grew by 6% and totaled 52,439, the growth driven by enhanced accessibility of connection due to the transition to online channels, improved purchasing power as a result of subsidized real property loans and information on possible cancellation of privilleged technological connection. The share of electronic applications filed with the use of personal account in 2022 totaled 99%. In 2022, the Company concluded 30,876 contracts (+1%YoYyear on year) and executed 27,177 contracts (-8%YoYyear on year). Capacity demand in concluded contracts also increased by 18%.
Demand for connection (pcs)*
Demand for connection (MW)*
| Metrics | MU | 2020 | 2021 | 2022 | 2022/2021, % |
|---|---|---|---|---|---|
| Applications filed | pcs | 41,888 | 49,290 | 52,439 | 6% |
| Applications filed | kW | 2,935,258 | 3,442,436 | 4,190,455 | 22% |
| Contracts concluded | pcs | 27,428 | 30,524 | 30,876 | 1% |
| Contracts concluded | kW | 806,473 | 811,009 | 820,289 | 1% |
| Contracts executed | pcs | 24,093 | 29,623 | 27,177 | -8% |
| Contracts executed | kW | 573,941 | 678,611 | 656,721 | -3% |
| Active contracts | pcs | 19,609 | 18,725 | 21,324 | 14% |
| Active contracts | kW | 1,796,348 | 1,684,551 | 1,761,949 | 5% |
| Executed contracts by categories of applicants: | |||||
| 0-15 kW inclusive | pcs | 22,130 | 27,448 | 25,092 | -9% |
| 15-150 kW inclusive | pcs | 1,619 | 1,860 | 1,793 | -4% |
| 150-670 kW | pcs | 264 | 237 | 212 | -11% |
| 670+ kW | pcs | 77 | 75 | 78 | 4% |
| Generation | pcs | 3 | 3 | 2 | -33% |
| 0-15 kW inclusive | kW | 265,821 | 342,978 | 316,095 | -8% |
| 15-150 kW inclusive | kW | 103,301 | 129,633 | 122,753 | -5% |
| 150-670 kW | kW | 71,405 | 70,566 | 62,575 | -11% |
| 670+ kW | kW | 117,409 | 122,528 | 154,494 | 26% |
| Generation | kW | 16,005 | 12,906 | 805 | -94% |
| Revenues from connection by categories of applicants: | |||||
| 0-15 kW inclusive | RUBruble million | 42 | 64 | 92 | 44% |
| 15-150 kW inclusive | RUBruble million | 46 | 74 | 93 | 25% |
| 150-670 kW | RUBruble million | 348 | 325 | 332 | 2% |
| 670+ kW | RUBruble million | 165 | 288 | 706 | 145% |
| Generation | RUBruble million | 119 | 0.06 | 17 | 28236% |
| Executed contracts by industries: | |||||
| Individuals | pcs | 19,973 | 25,085 | 23,323 | -7% |
| Agriculture, forestry, fishery | pcs | 175 | 152 | 174 | 14% |
| Manufacturing industry | pcs | 129 | 122 | 132 | 8% |
| Production and distribution of electricity, gas and water | pcs | 166 | 156 | 139 | -11% |
| Real estate development | pcs | 545 | 583 | 514 | -12% |
| Trade industry | pcs | 295 | 291 | 302 | 4% |
| Transportation and telecommunications | pcs | 658 | 801 | 620 | -23% |
| Public health, education, social services | pcs | 175 | 124 | 93 | -25% |
| Other | pcs | 1,977 | 2,309 | 1,880 | -19% |
| Individuals | kW | 250,237 | 323,086 | 300,065 | -7% |
| Agriculture, forestry, fishery | kW | 21,621 | 13,036 | 15,291 | 17% |
| Manufacturing industry | kW | 27,658 | 31,192 | 56,791 | 82% |
| Production and distribution of electricity, gas and water | kW | 46,578 | 63,474 | 30,178 | -52% |
| Real estate development | kW | 40,718 | 43,002 | 38,743 | -10% |
| Trade industry | kW | 21,836 | 14,815 | 15,038 | 2% |
| Transportation and telecommunications | kW | 5,862 | 7,549 | 11,078 | 47% |
| Public health, education, social services | kW | 11,483 | 7,005 | 4,865 | -31% |
| Other | kW | 147,948 | 175,453 | 184,671 | 5% |
Cancelled contracts
| Connection contracts cancelled during the reported period * | |||
|---|---|---|---|
| Contracts | MWmegawatt | Contract value, RUBruble million, net of VATvalue-added tax |
|
| Permenergo | 824 (-35% to 2019) | 95 (+67%) | 123 (-35%) |
| Sverdlovenergo | 715 (-24%) | 21 (-42%) | 26 (-71%) |
| Chelyabenergo | 1 056 (-10%) | 76 (+33%) | 125 (+37%) |
| 2020 TOTAL | 2 595 (-23%) | 192 (+28%) | 274 (-26%) |
| Permenergo | 679 (-18% to 2020) | 33 (-65%) | 83 (-33%) |
| Sverdlovenergo | 356 (-50%) | 63 (+200%) | 59 (+127%) |
| Chelyabenergo | 768 (-27%) | 105 (+38%) | 99 (-21%) |
| 2021 TOTAL | 1803 (-31%) | 201 (+5%) | 241 (-12%) |
| Permenergo | 311 (-54% to 2021) | 23 (-30%) | 102 (+23%) |
| Sverdlovenergo | 268 (-25%) | 32 (-49%) | 47 (-20%) |
| Chelyabenergo | 538 (-30%) | 27 (-74%) | 36 (-64%) |
| 2022 TOTAL | 1117 (-38%) | 82 (-59%) | 185 (-23%) |
Connection requests are waived due to changes in terms for construction of filer’s facility, lack of intentions to construct any facilities, lack of funds or expiration of specifications.
During 2022, Permenergo cancelled 311 contracts (-54%YoYyear on year) with the total capacity of 23 MWmegawatt and worth RUBruble 102 million (net of VATvalue-added tax). Most of the contracts (82%) were cancelled by 0-15 kW applicants, 69% of cancellations done by individuals.
During 2022, Sverdlovenergo cancelled 268 contracts (-25%YoYyear on year) with the total capacity of 32 MWmegawatt and worth RUBruble 47 million (net of VATvalue-added tax). Most of the contracts (75%) were cancelled by 0-15 kW applicants, 67% of cancellations done by individuals.
During 2022, Chelyabenergo cancelled 538 contracts (-30%YoYyear on year) with the total capacity of 27 MWmegawatt and worth RUBruble 36 million (net of VATvalue-added tax). Most of the contracts (81%) were cancelled by 0-15 kW applicants, 74% of cancellations done by individuals.
The most important connections in 2022 are:
- KGBU Highways and Transport Directorate of the Perm region (RUBruble 45 million, 3.6 MWmegawatt): power supply of object “Construction of highway Ulitsa Stroiteley – Ploshchad Gaydara” (development of road infrastructure in the Perm region);
- AOJoint-Stock Company SZ Kortros – Perm (RUBruble 35 million, 1.5 MWmegawatt): power supply of apartment building and kindergarten (development of house construction and improvement of housing affordability);
- OOOLimited Liability Company SHKOLA NOVYE LYADY (RUBruble 30 million, 0.6 MWmegawatt): power supply of 1000-seat secondary school (advancement of education in the Perm region);
- AOJoint-Stock Company Transneft Prikamye (RUBruble 21 million, 0.7 MWmegawatt): power supply of oil-pumping station (development of the oil industry in the Perm region).
- GKU of the Sverdlovsk Region (1st stage: RUBruble 430 million, 17 MWmegawatt): connection of 2023 International University Sports Festival facilities;
- OOOLimited Liability Company Zhilstroykompleks (RUBruble 1.4 million, 0.356 MWmegawatt): connection of 2 6/0.4 kV package transformer substation to provide power supply of residential construction area (development of house construction and improvement of housing affordability);
- AOJoint-Stock Company YuGK (RUBruble 83 million, 14 MWmegawatt): connection of 10 kV power line for power supply of 110/6 kV Novyi Kurasan substation (development of mining industry in the Chelyabinsk region);
- MKUmunicipal public institution Chelyabstroyzakazchik (RUBruble 2 million, 0.2 MWmegawatt): connection of a kindergarten (advancement of preschool education in the Chelyabinsk region);
- AOJoint-Stock Company Chelyaboblkommunenergo (RUBruble 6 million, 0.16 MWmegawatt): connection of gas boiler house (improvements in living standards of the population in the Chelyabinsk region).
- MBU Sport Ski School No.5 in Chelyabinsk (RUBruble 24 million, 0.28 MWmegawatt): connection of a rollerskis track in the Central District of Chelyabinsk (development of sports infrastructure of the Chelyabinsk region).